
One intelligence company
Measurement institutions can act on, and stand behind.
LearnerMetrics builds intelligence for two closely related missions: helping colleges and universities retain and progress their students, and helping regions grow the businesses they support. Both run on the same measurement platform.
Higher education
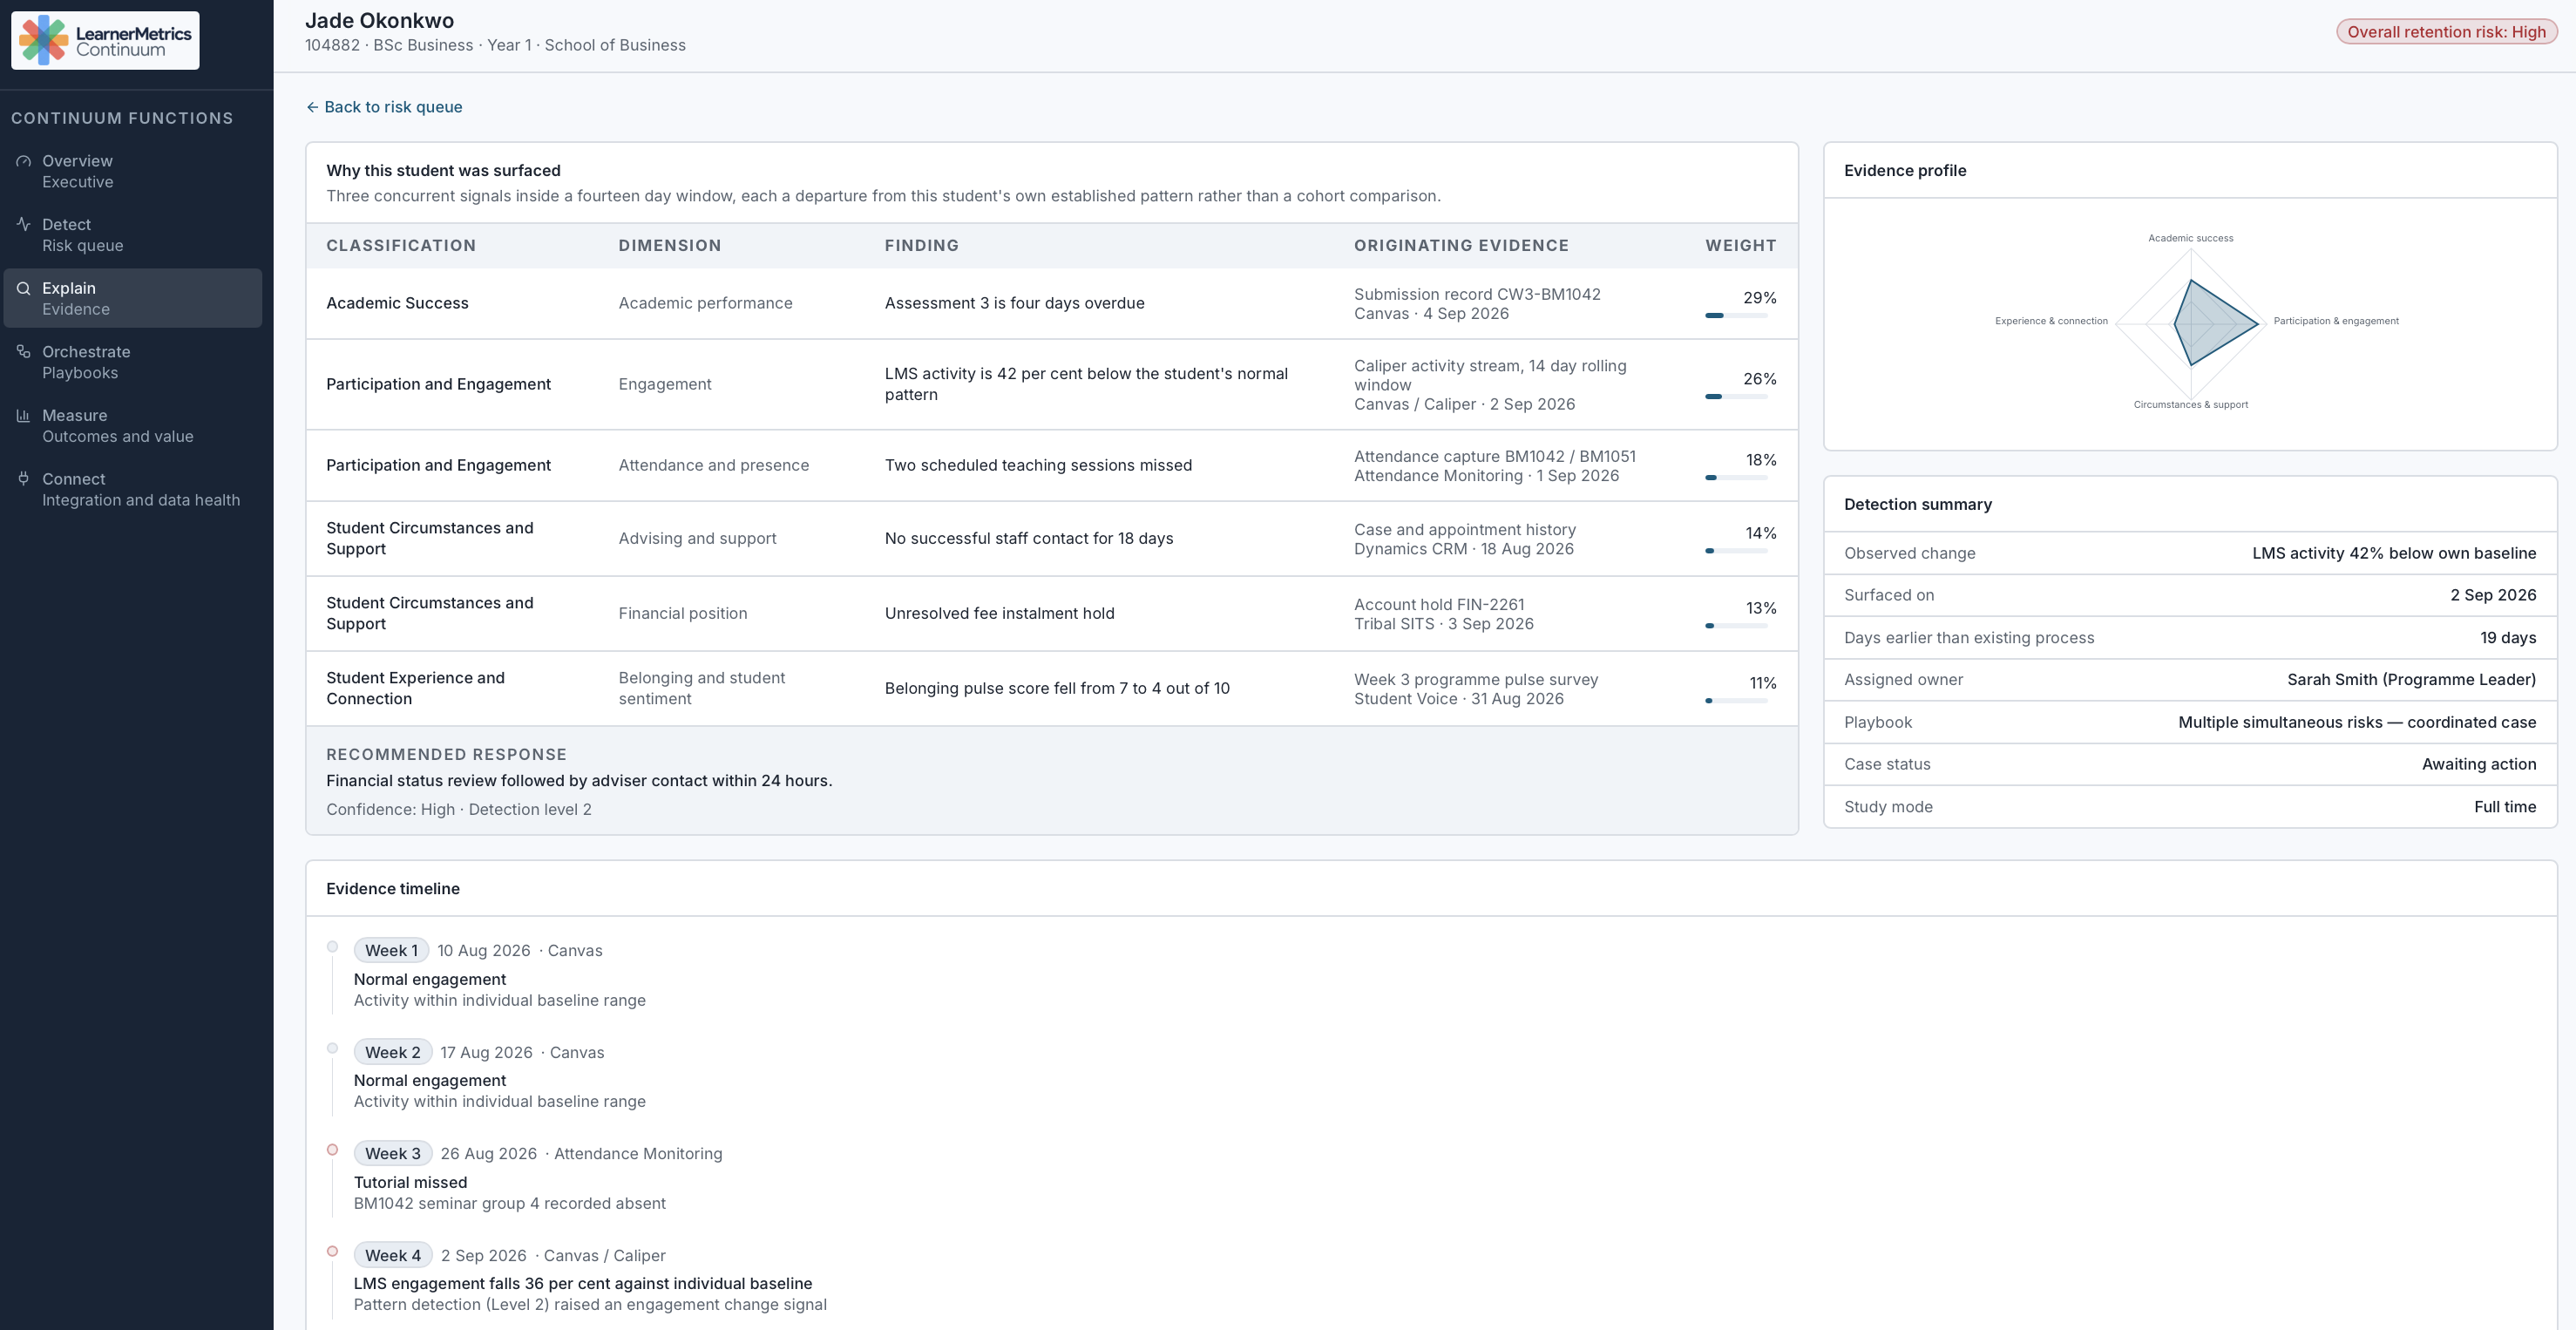
 Continuum
Student retention and success intelligence. See who is at risk, why, and whether your interventions worked — term over term, cohort by cohort.
- Early alerts grounded in your own history
- Cohort equity and progression analysis
- Intervention tracking and outcome reporting
Economic development
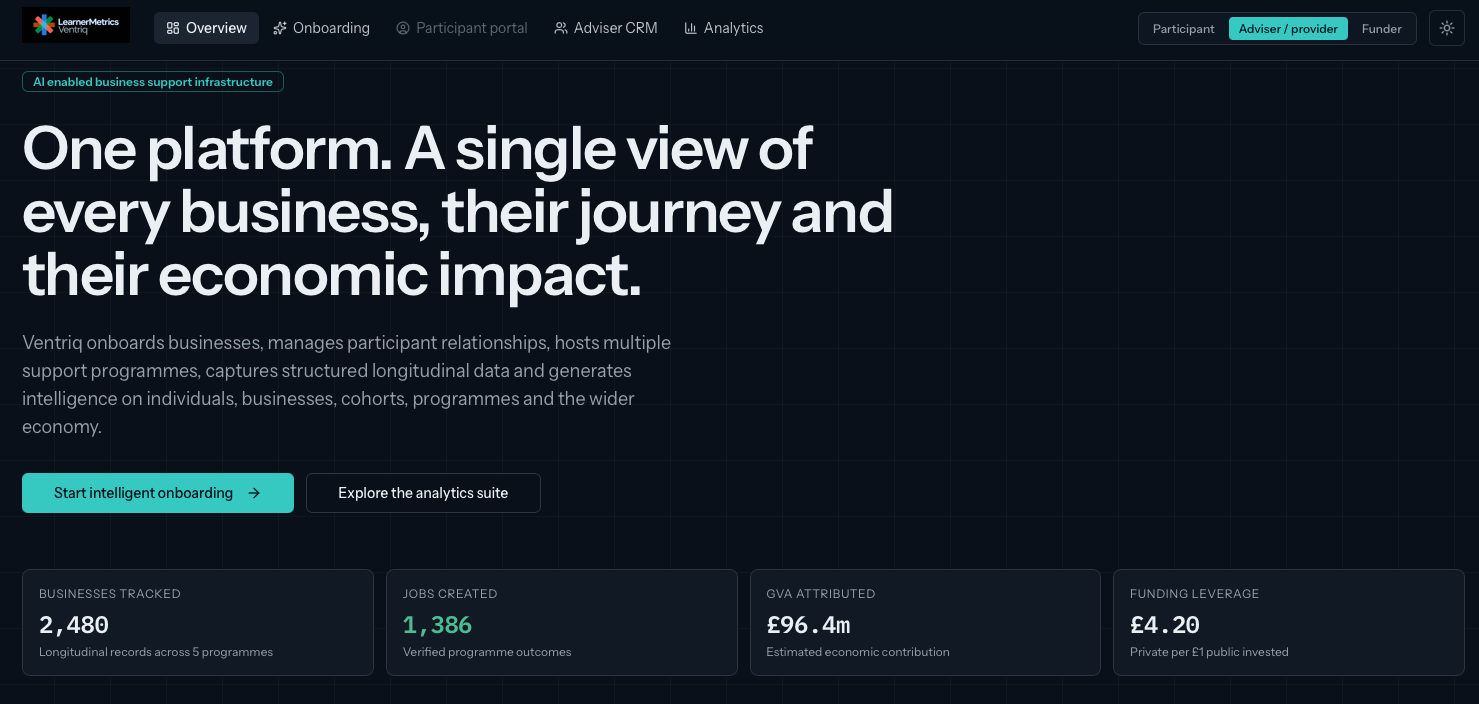
 Ventriq
Growth intelligence for economic development and business support. Understand the portfolio you serve, where support lands, and what it returns.
- Business support portfolio and pipeline views
- Programme performance and funder reporting
- Regional sector and workforce signals
The common platform
One workflow behind both products
Different audiences, same discipline: connect the data, agree the definitions, surface the signal, then evaluate what changed.
Connect
Bring together the records you already keep — student systems, CRM, survey, programme and business support data.
Model
Shared definitions and transparent methods turn those records into measures your teams can defend.
Surface
Cohort views, early signals and portfolio dashboards for the people who act on them.
Act & evaluate
Track interventions and report the outcome, so the next decision starts from evidence.
Evidence
Reported honestly, checked openly
Illustrative figures shown while partner results are being prepared for publication. Every number we publish carries its method and period.
Measured against matched prior cohorts.
Progression differences by cohort and programme.
Which businesses receive what, and where.
Funder-ready reporting on invested support.
See the platform on your data
A 30-minute working session with our team: your questions, your metrics, and a walkthrough of Continuum or Ventriq.